 When discussing businesses for sale with buyers and sellers of small and medium-sized businesses, the conversation inevitably turns to valuation. As these conversations continue, it also often becomes clear that a lot of confusion and incorrect information exist in the marketplace about this topic. This blog post provides an update on the latest valuation trends we are seeing, using only the best-quality data available from independent sources.
Good Data is Hard to Find
Small and medium-sized businesses for sale are generally privately-owned. This means transactions involving them are not typically reported to the public or to any government entity that publishes statistics on them. Thus it can be hard to find transaction data sets with enough data points to be useful or significant. Some business brokers and other mergers and acquisitions intermediaries in the marketplace will point to their “proprietary databases” of transactions, but these typically do not have enough data points and/or are not collected in a consistent, timely enough manner to be able to tell us anything useful.
Fortunately, one high-quality (and free!) data source exists: the Private Capital Markets Project at Pepperdine University. This academic center publishes a quarterly report discussing valuation trends in the small and medium-sized business marketplace, a link to the latest version of which be found on our Resources page. This quarterly report is valuable in that it does contain a lot of data points. Each quarter, the folks behind the report survey M&A professionals across the country. For example, the survey for the first quarter of 2014 was completed by 250 respondents from 42 states representing 235 transactions. These survey results are carefully compiled and presented in a consistent format. This quality work allows us to glean some useful and relevant insights about valuations for small and medium-sized businesses for sale.
Sustainable Cash Flow as the Common Thread
Many things are important in developing views on valuation for small and medium-sized businesses for sale. We discussed a number of these in our last blog post Sell Your Business Masterfully: 5 Crucial Questions. Each business is different and has a unique story and characteristics that go into its value. That said, in looking at a large data set of transactions and seeking insight that allows us to compare companies to each other, we need a common characteristic for each we can compare. This common characteristic is sustainable cash flow, or the cash a company can be expected to produce dependably year-after-year.
What does it mean to produce cash flow “dependably year-after-year?” This is where valuation becomes subjective, more art than science. However, the cash flow a business can be reasonably expected to make, free of one-time or extraordinary items, is the key guiding concept. Looking forward into the future requires a great deal of assumptions. Thus, many people instead choose to focus on the recent past, taking the historical financial performance for the business and making adjustments to these numbers to arrive at sustainable cash flow. These adjustments often mean adding back one-time expenses that aren’t expected to continue, or removing sales and profits from one-time pieces of business that are not expected to continue for the company.
Cash Flow Multiple as the Market Measure
Once sustainable cash flow is calculated for each company, the sale price for each transaction can be divided by this cash flow to provide a cash flow multiple for a transaction. In this way, every transaction, regardless of the specifics of the company involved, can be thought of having a transaction multiple. These multiples can then be averaged across a large data set to provide a view of value for similarly-sized businesses. The Pepperdine report takes this approach in providing insight into valuations in the market. It is not perfect, but it does give us a view of valuation across a large data set.
Businesses for Sale – Latest Valuation Data
The Pepperdine report breaks companies into segments by size. Displayed below is a chart of cash flow multiples using the data in the latest report available (Q1’14) when this blog post was written. If you go to our Resources page and follow the link to the latest Pepperdine report, you will note that our chart below is a little different from theirs. This is because we made an attempt to clean up some of the more confusing aspects of the reported data. You can read more about this in the footnote at the bottom of this blog post. You may also be asking, “What are the SDE and EBITDA measures of cash flow?” These are also described for you in the footnote below.
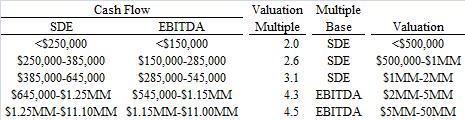
How do you read this chart? First find the row with the level of sustainable cash flow for the company you are considering. Second, multiply that cash flow by the multiple produced by the Pepperdine report’s survey results. (Please note, the top three rows use SDE as the base, and the bottom two rows use EBITDA as the base.) The product is the expected valuation according to the survey data. For example, if your company has $300,000 in sustainable cash flow as measured by SDE (see footnote), then the relevant multiple is 2.6x. $300,000 x 2.6 = $780,000. So then, the Pepperdine report indicates that ballpark valuation for your business is $780,000. From here, you would want to work with a professional to improve this value as described below in the Maximizing Valuations section.
Key Takeaways from the Chart
- As the size of the sustainable cash flow of a business increases, so too does its valuation multiple.
- Businesses above $500-600k in cash flow see a material jump in valuation multiple.
- Businesses with $10MM or less in cash flow are not generally seeing a 5x valuation multiple at present.
The last takeaway is often the most surprising for some people in the small to medium-sized business marketplace. The data shows that it is uncommon for businesses in this segment of the market to sell for big multiples like 6-7x. The reason for this has to do with the types and level of aggression of deal financing sources available to buyers and will be discussed in more detail in a later blog post.
Valuation Trends
Below is a graph showing quarterly valuation multiple trends using the Pepperdine report’s valuation size categories.
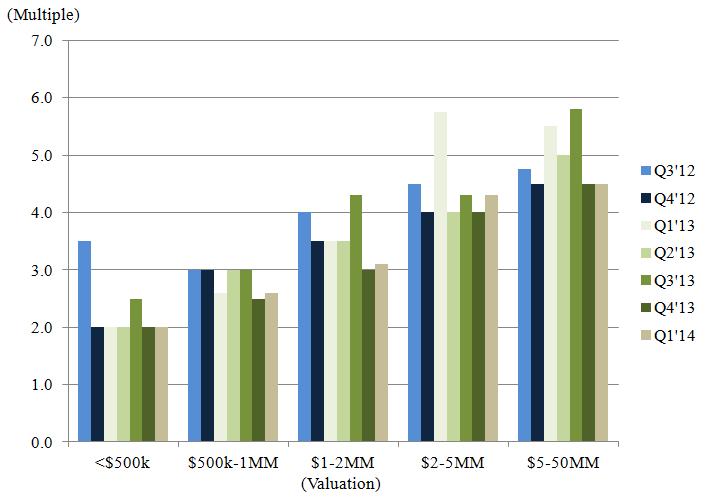
How do you read this chart? The x-axis shows the Pepperdine report’s valuation categories. The different bars show the change in the valuation multiple for that category over time. (Please note that the left three categories are a multiple of SDE. The right two categories are a multiple of EBITDA.)
Key Takeaways from the Chart
- Valuation multiples are still down a bit or flat from where they were a year ago. This is especially true for higher valuation categories.
- The higher valuation categories show more multiple volatility than the smaller ones.
- Despite the volatility, valuation multiples remain in a relatively small range. As noted above, valuations in the 6-7x range are not common.
Maximizing Valuations
It is important to remember that these results are simply averages across a large number of transactions. They are useful for a ballpark idea of what a business might be worth. But, to truly maximize valuation, you need the help of experienced professionals. Our Business Consulting services are designed to help business owners develop deeper value in their businesses, and our Mergers and Acquisitions advisory services will ensure the right buyers are targeted and the right sale process is run to maximize the value of each business and to tell its unique story. Please Contact Us if we can help.
Footnote
The Pepperdine report shows valuation multiples given the ending valuation. This is somewhat backwards from our perspective given that we often have a cash flow level and want to know what multiple we should apply to this cash flow figure to arrive at a valuation. To aid in this, we backed into the SDE and EBITDA figures implied by the valuation categories and multiples.
Please remember that EBITDA stands for Earnings Before Interest, Taxes and Depreciation & Amortization. To arrive at this number, we typically start with Net Income and add back interest, taxes and depreciation & amortization. As discussed above we also add or subtract any one-time items in an effort to get to a sustainable number. We also add back any non-cash income or expenses.
SDE stands for Seller’s Discretionary Income. This number is typically calculated by arriving at EBITDA as described above, then adding back any compensation paid to the owner. To facilitate switching back and forth between SDE and EBITDA, we assumed a replacement manager compensation of $100,000 (inclusive of all costs, benefits, etc.)